Bulletin of the Second National Pollution Source Survey in Guangyuan City
Guangyuan ecological environment bureau
Guangyuan statistics bureau
Guangyuan agriculture village bureau
Guangyuan housing and urban construction bureau
Announcement on Issuing the Bulletin of the Second National Pollution Source Survey in Guangyuan City
According to the provisions of Article 31 of the National Pollution Source Survey Regulations, with the approval of the Office of the Second National Pollution Source Survey Leading Group in Sichuan Province and the consent of the Second National Pollution Source Survey Leading Group in Guangyuan City, the Bulletin of the Second National Pollution Source Survey in Guangyuan City is hereby issued.
Guangyuan ecological environment bureau Guangyuan statistics bureau
Guangyuan agriculture village bureau Guangyuan housing and urban construction bureau
the year of 2020twelvemoon2sun
Bulletin of the Second National Pollution Source Survey in Guangyuan City
According to the Regulations on the National Pollution Source Survey and the Notice of the State Council on Launching the Second National Pollution Source Survey (Guo Fa [2016〕59No.), the standard time for the second national pollution source survey is2017yeartwelvemoon31Date and period data are as follows2017Year. The survey targets are industrial pollution sources (hereinafter referred to as "industrial sources"), agricultural pollution sources (hereinafter referred to as "agricultural sources"), domestic pollution sources (hereinafter referred to as "living sources"), centralized pollution control facilities and mobile sources.
According to the unified deployment, all relevant departments at all levels have carefully planned and organized, and the majority of census objects have strongly supported and actively participated. At present, the second national pollution source survey task in Guangyuan City, Sichuan Province has been completed, and the basic situation of various pollution sources, the discharge amount of major pollutants, pollution control, etc. have been found out, and key pollution source files and pollution source information databases have been established. The main data are now published as follows.
I. General situation
(A) the number of various census objects
Number of census objects in the city5661A (excluding mobile source). Include industrial sources.2020A scale farm for livestock and poultry.684A source of life2659Centralized pollution control facilities289A, and the number of census objects in administrative regions as a unit.nineA.
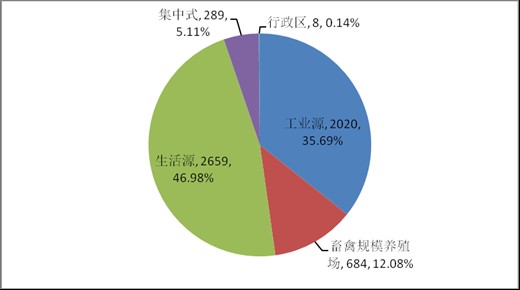
pictureone Figure of quantity proportion of various pollution sources
(2) Emissions of pollutants
1. Water pollutant discharge
Chemical oxygen demand38076.62Ton, ammonia nitrogen1763.47Tons, total nitrogen5518.93Ton, total phosphorus619.06Tons of animal and vegetable oil975.07Tons, petroleum3.42Ton, cyanide7.10G, heavy metals (lead, mercury, cadmium, chromium and metalloid arsenic, the same below)64.91Kilogram.
tableone Discharge of Main Water Pollutants in Guangyuan City
2. Discharge of water pollutants in river basin
Discharge of water pollutants in Guangyuan section of Jialing River Basin. Chemical oxygen demand35058.68Ton, ammonia nitrogen1616.94Tons, total nitrogen5078.14Ton, total phosphorus568.51Tons of animal and vegetable oil881.84Ton, cyanide6.35Dick. Among them, the water pollution discharge of the main stream of Jialing River and its main first-class tributaries is as follows:
The discharge of pollutants from the main stream of Jialing River is chemical oxygen demand.8864.27Ton, ammonia nitrogen332.87Tons, total nitrogen1086.90Ton, total phosphorus127.49Tons of animal and vegetable oil157.68Ton, cyanide4.37G;
The discharge amount of water pollutants in Bailong River is chemical oxygen demand.5129.02Ton, ammonia nitrogen367.25Tons, total nitrogen981.19Ton, total phosphorus101.22Tons of animal and vegetable oil175.25Ton, cyanide0.48G;
The pollutant discharge of Donghe River is chemical oxygen demand.11481.09Ton, ammonia nitrogen518.13Tons, total nitrogen1653.48Ton, total phosphorus183.99Tons of animal and vegetable oil316.03Ton, cyanide1.50G;
The pollutant discharge of Xihe River is chemical oxygen demand.5104.93Ton, ammonia nitrogen209.34Tons, total nitrogen740.32Ton, total phosphorus84.35Tons of animal and vegetable oil120.59Ton, cyanide0G;
The pollutant discharge of Nanhe River is chemical oxygen demand.2396.31Ton, ammonia nitrogen102.64Tons, total nitrogen301.31Ton, total phosphorus36.47Tons of animal and vegetable oil55.83Ton, cyanide0G;
The pollutant discharge of Wenxi River is chemical oxygen demand.686.94Ton, ammonia nitrogen28.81Tons, total nitrogen103.05Ton, total phosphorus11.81Tons of animal and vegetable oil16.35Ton, cyanide0G;
Baixihao water pollutant discharge is chemical oxygen demand.1396.11Ton, ammonia nitrogen60.90Tons, total nitrogen211.89Ton, total phosphorus23.17Tons of animal and vegetable oil40.12Ton, cyanide0Dick.
The discharge of water pollutants in Guangyuan section of Qujiang River Basin is chemical oxygen demand.3017.94Ton, ammonia nitrogen143.53Tons, total nitrogen440.79Ton, total phosphorus50.55Tons of animal and vegetable oil93.23Ton, cyanide0.75Dick. Among them, the pollutant discharge of enyang River is chemical oxygen demand.1022.48Ton, ammonia nitrogen49.29Tons, total nitrogen136.69Ton, total phosphorus16.42Tons of animal and vegetable oil28.34Ton, cyanide0Dick.
table2Discharge of Main Water Pollutants in Guangyuan Section of Jialing River and Qujiang River Basin
3. Emissions of air pollutants
sulphur dioxide0.59Ten thousand tons, nitrogen oxides1.54Ten thousand tons, particulate matter2.11Ten thousand tons, this census conducted a tentative survey of volatile organic compounds in some industries and fields. Volatile organic compounds0.90Ten thousand tons.
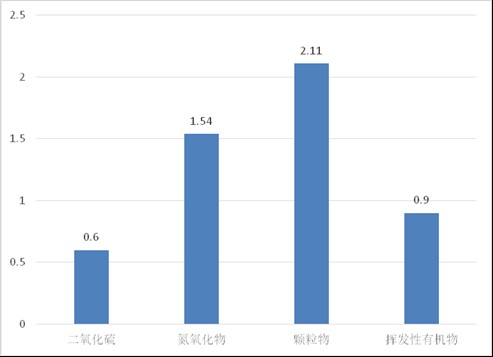
picture2 Map of Emission of Major Air Pollutants in Guangyuan City Unit: 10,000 tons
Second, industrial sources
(1) Basic information
Industrial enterprise or industrial activity unit2020A.
The number of industrial source census objects is in the topthreeCounty: Lizhou District418Cangxi county401Wangcang county.332A. the above-mentionedthreeThe total number of industrial source census objects accounted for by regions.56.98%.
The number of industrial source census objects is in the topthreeIndustry: non-metallic mineral products industry528Wood processing and wood, bamboo, rattan, palm and grass products industries.272Agricultural and sideline food processing industry247A. the above-mentionedthreeIndustry accounts for the total number of industrial source census objects51.83%.
(2) Water pollutants
Wastewater treatment facilities in industrial enterprises497Set, design processing capacity16.37Ten thousand cubic meters/Daily and annual actual wastewater treatment capacity1052.14Ten thousand cubic meters. Water pollutant discharge is chemical oxygen demand.365.22Ton, ammonia nitrogen7.91Tons, total nitrogen34.04Ton, total phosphorus4.08Tons, petroleum3.42Ton, cyanide7.10Gram, heavy metal61.11Kilogram.
Chemical oxygen demand (cod) emissions rank in the topthreeIndustry: agricultural and sideline food processing industry177.63Tons, wine, beverage and refined tea manufacturing industry.58.09Tons, coal mining and washing industry51.70Tons. the above-mentionedthreeThe total amount of chemical oxygen demand emissions from industrial sources accounted for by three industries78.70%.
Ammonia nitrogen emissions are in the topthreeIndustry: agricultural and sideline food processing industry5.46Tons of water production and supply industry0.94Tons, wine, beverage and refined tea manufacturing industry.0.76Tons. the above-mentionedthreeThe total amount of ammonia nitrogen emissions from industrial sources accounted for by three industries90.52%.
Total nitrogen emissions are at the top.threeIndustry: agricultural and sideline food processing industry17.79Tons of water production and supply industry10.73Tons, wine, beverage and refined tea manufacturing industry.2.24Tons. the above-mentionedthreeTotal nitrogen emissions from industrial sources accounted for by three industries90.36%.
Total phosphorus emissions are in the top position.threeIndustry: agricultural and sideline food processing industry2.6Tons of water production and supply industry0.56Tons, food manufacturing industry0.47Tons. the above-mentionedthreeTotal phosphorus emissions from industrial sources accounted for by three industries88.97%.
Oil emissions are at the top.threeIndustry: metal products industry1.97Tons, coal mining and washing industry0.59Tons, nonmetallic mineral products industry0.34Tons. the above-mentionedthreeThe total amount of oil emissions from industrial sources accounted for by three industries84.80%.
Cyanide emission industry: pharmaceutical manufacturing industry7.10G, other industries have no emissions.
Heavy metal emission industry: coal mining and washing industry61.09Kilogram, pharmaceutical manufacturing industry0.01Kilogram, automobile manufacturing industry2.00Dick. the above-mentionedthreeThe total amount of heavy metal emissions from industrial sources accounted for by three industries99.98%.
(3) Air pollutants
Desulfurization facilities in industrial enterprisesfifty-sixSet, denitrification facilitiesnineSet, dust removal facilitiesnine hundred and forty-fiveSet. The emission of air pollutants is sulfur dioxide.4186.51Tons, nitrogen oxides4748.45Tons of particulate matter13946.22Tons, volatile organic compounds584.79Tons.
Sulfur dioxide emissions are at the top.threeIndustry: non-metallic mineral products industry2444.75Tons, nonferrous metal smelting and rolling processing industry1106.98Tons, oil, coal and other fuel processing industries.148.48Tons. the above-mentionedthreeThe total amount of sulfur dioxide emissions from industrial sources accounted for by three industries88.38%.
Nitrogen oxide emissions are in the top.threeIndustry: non-metallic mineral products industry3355.57Tons, oil, coal and other fuel processing industries.347.27Tons, chemical raw materials and chemical products manufacturing industry297.08Tons. the above-mentionedthreeThe total amount of nitrogen oxide emissions from industrial sources accounted for by three industries84.24%.
Particulate matter emissions rank first.threeIndustry: non-metallic mineral products industry6906.10Tons, coal mining and washing industry4167.14Ton, non-metallic ore mining and dressing industry1133.05Tons. the above-mentionedthreeThe total amount of particulate matter emissions from industrial sources accounted for by three industries87.52%.
The emission of volatile organic compounds ranks in the top.threeIndustry: non-metallic mineral products industry258.08Tons, oil, coal and other fuel processing industries.80.85Tons, chemical raw materials and chemical products manufacturing industry52.20Tons. the above-mentionedthreeTotal emissions of volatile organic compounds from industrial sources accounted for by three industries66.88%.
(4) Industrial solid waste
1. General industrial solid waste
Output of general industrial solid waste172.07Ten thousand tons, comprehensive utilization155.78Ten thousand tons (including comprehensive utilization of previous years’ storage)3.00Tons), disposal capacity14.02Ten thousand tons, this year’s storage capacity2.27Ten thousand tons, dumped and discarded5.33Tons.
2. Hazardous waste
Hazardous waste output4077.29Tons, comprehensive utilization and disposal capacity3991.70Tons, year-end cumulative storage195.29Tons.
(5) Associated radioactive mines
Associated radioactive mines are mainly targeted at those that may be associated with natural radionuclides.15Activity units of mineral mining, smelting and processing industries. Through the whole cityeightClass key industries186The initial test and screening of 100 enterprises have determined the enterprises to be included in the detailed investigation.threeHome, mainly distributed in wangcang county, Chaotian District, are all coal mining enterprises.
Iii. Agricultural sources
(1) Basic information
Counties and districts involved in plantingeightA county of aquaculture.sevenCounties and districts of livestock and poultry breeding industryeightA household survey of livestock and poultry scale farms684A.
Discharge of pollutants from agricultural source water: chemical oxygen demand19404.09Ton, ammonia nitrogen387.06Tons, total nitrogen3212.98Ton, total phosphorus447.88Tons.
(2) Planting industry
Discharge (loss) of water pollutants: ammonia nitrogen189.32Tons, total nitrogen1911.02Ton, total phosphorus206.69Tons.
Usage of plastic film2647Ton, cumulative residue340.66Tons.
(3) Livestock and poultry breeding industry
Water pollutant discharge: chemical oxygen demand18946.88Ton, ammonia nitrogen177.14Tons, total nitrogen1242.81Ton, total phosphorus230.12Tons. Among them:
Discharge of water pollutants from livestock and poultry farms: chemical oxygen demand9263.06Ton, ammonia nitrogen81.79Tons, total nitrogen669.60Ton, total phosphorus116.71Tons.
(4) Aquaculture (excluding algae)
Water pollutant discharge: chemical oxygen demand457.21Ton, ammonia nitrogen20.60Tons, total nitrogen59.15Ton, total phosphorus11.07Tons.
Fourth, the source of life
(1) Basic information
Life source census object2659A. In which: Administrative Village2411Unit boilers of non-industrial enterprises58Oil storage depotoneGe, gas station189A. Urban residents’ living sources are based on urban areas and counties (including towns).
(2) Water pollutants
Discharge of pollutants from domestic source water: chemical oxygen demand18262.98Ton, ammonia nitrogen1358.43Tons, total nitrogen2259.70Ton, total phosphorus166.94Tons of animal and vegetable oil975.07Tons.
Discharge of pollutants from urban domestic source water: chemical oxygen demand6228.03Ton, ammonia nitrogen719.21Tons, total nitrogen1042.14Ton, total phosphorus74.50Tons of animal and vegetable oil201.94Tons.
Discharge of pollutants from rural domestic source water: chemical oxygen demand12034.95Ton, ammonia nitrogen639.22Tons, total nitrogen1217.56Ton, total phosphorus92.44Tons of animal and vegetable oil773.13Tons.
(3) Air pollutants
Emissions of air pollutants from domestic sources: sulfur dioxide1762.58Tons, nitrogen oxides1364.84Tons of particulate matter6600.12Tons, volatile organic compounds5787.70Tons.
V. Centralized pollution control facilities
(1) Basic information
Centralized sewage treatment unit100Units for centralized treatment and disposal of domestic garbage186Units for centralized utilization and disposal (treatment) of hazardous wastesthreeA.
Pollutant discharge of waste water (leachate) from garbage disposal and hazardous waste (medical waste) disposal: chemical oxygen demand44.33Ton, ammonia nitrogen10.07Tons, total nitrogen12.21Ton, total phosphorus0.16Tons, heavy metals3.80Kilogram.
Waste incineration and hazardous waste (medical waste) incineration waste gas pollutant emission: sulfur dioxide.18.21Tons, nitrogen oxides62.56Tons of particulate matter8.01ton(Garbage incineration power plant has been included in industrial sources.).
(II) Centralized sewage treatment
Urban sewage treatment plant92A, sewage treatment6041.02Ten thousand cubic meters; Industrial sewage centralized treatment plantfiveA, sewage treatment32.53Ten thousand cubic meters; Rural centralized sewage treatment facilitiesthreeA, sewage treatment8.07Ten thousand cubic meters. Total annual sewage treatment6081.61Ten thousand cubic meters.
Reduction of water pollutants: chemical oxygen demand9606.83Ton, ammonia nitrogen1123.49Tons, total nitrogen1680.73Ton, total phosphorus119.40Tons of animal and vegetable oil148.86Tons.
Dry sludge output8636.00Ton, disposal capacity7040.20Tons.
(3) Centralized treatment and disposal of domestic garbage
Garbage disposal capacity54.36Ten thousand tons, of which: landfill.46.18Ten thousand tons, burning8.18Ten thousand tons.
(4) centralized utilization and disposal (treatment) of hazardous wastes
Hazardous waste centralized utilization and disposal plantthreeA, including hazardous waste disposal plant.2Medical waste treatment (disposal) plantoneA. Design, disposal and utilization capacity33825ton/In, the actual disposal and utilization of hazardous waste17372Tons. Among them:
Medical waste1280Tons, comprehensive utilization of hazardous waste.16092Tons.
Six, mobile source
(1) Basic information
Mobile source survey objects include motor vehicles and off-road mobile sources. Statistical summary of motor vehicle ownership386231Total diesel power of vehicles and agricultural machinery209.51Ten thousand kilowatts, civil aviation aircraft take-off and landing sorties15397Time.
Emissions of air pollutants: nitrogen oxides9237.66Tons of particulate matter590.53Tons, volatile organic compounds2640.36Tons.
(2) Motor vehicle pollution sources
Emissions of air pollutants: nitrogen oxides3410.53Tons of particulate matter56.80Tons, volatile organic compounds1853.39Tons.
(3) Non-road mobile pollution sources
Emissions of air pollutants: nitrogen oxides5827.13Tons of particulate matter533.73Tons, volatile organic compounds786.97Tons. Among them:
Nitrogen oxides emitted by construction machinery1658.81Tons of particulate matter83.56Tons, volatile organic compounds168.81Tons;
Agricultural machinery emits nitrogen oxides.4094.26Tons of particulate matter447.71Tons, volatile organic compounds612.62Tons;
Nitrogen oxides emitted by civil aviation aircraft74.06Tons of particulate matter2.46Tons, volatile organic compounds5.54Tons.
First, the scope of pollution source survey
(1) Scope of general survey of industrial sources:Including the National Economic Industry Classification (GB/T
4754—2017) mining, manufacturing, electricity, heat, gas and water production and supply industries.threeAmong the categories41All industrial enterprises or industrial activity units in each industry. May be accompanied by natural radionuclides.eightClass key industries15Activity units of mineral mining, smelting and processing industries; Industrial parks (industrial parks) in national and provincial development zones. Does not include sewage treatment and its recycling (industry code is 4620) enterprise.
(two) the scope of agricultural source survey:Including planting, livestock and poultry breeding (excluding retail investors) and aquaculture (excluding algae).
(three) the scope of life source survey:Including the production and discharge of domestic sewage in urban areas, counties, towns and administrative villages, the energy use of urban and rural residents, boilers, oil storage tanks and gas stations in non-industrial enterprises.
(four) the scope of centralized pollution control facilities:Including centralized sewage treatment units, domestic garbage centralized treatment and disposal units and hazardous waste centralized utilization and disposal (treatment) units.
(five) the scope of mobile source survey:Including motor vehicles and non-road mobile sources, the survey was published in administrative districts.
(six) operating ships accounting waters:Including inland rivers and coastal waters. Among them, the accounting scope of coastal waters is the "Implementation Plan of Ship Air Pollutant Emission Control Zone" issued by the Ministry of Transport (Shanghai [2018〕168Number) in the coastal control area.
(seven) accounting scope of volatile organic compounds:The energy consumption of industrial enterprises and the production technology of main products include organized emission, urban and rural residents’ living consumption, the use of building coatings and adhesives, urban asphalt road pavement, foreign oil storage and civil gas stations, motor vehicles and off-road mobile sources.
(8) Guangyuan section of Jialing River Basin:Total length of rivers in Guangyuan, Jialing River261.5km, total basin area14880km2. Entering datan town in Chaotian District, it flows through Chaotian District, Lizhou District, Economic Development Zone, Zhaohua District, Jiange County and Cangxi County, and flows out of Guangyuan City into Langzhong City in Bamiao Town of Cangxi County, and flows through Guangyuan.sixCounties,36Towns, towns and offices,150An administrative village. Its watershed area is larger than500The first-class tributaries with a square kilometer mainly include Bailong River, Donghe River, Xihe River, Nanhe River, Wenxi River and Baixihao.
(9) Bailong River:Bailong River is the largest tributary on the right bank of the upper reaches of Jialing River, and the length of Bailong River in Guangyuan is88.3km, basin area6212km2, relative gap108m, the average river bed slope is about1.2Per thousand, multi-year average flow339mthree/s, velocity1.22m/s. After entering Yaodu Town, Qingchuan County, its main stream flows through Qingchuan County, Lizhou District, Economic Development Zone and Zhaohua District in turn from northwest to southeast, and flows into Jialing River in Zhaohua Ancient Town, Zhaohua District.
(10) East River:A tributary of the left bank of Jialing River. It originates from Daijiahe Dam at the southern foot of Dongmicang Mountain in Taoyuan Township, Nanjiang County, Bazhong City, flows through Nanjiang County, wangcang county, Cangxi County and Langzhong City, and joins Jialing River in Liangshan Village, Wencheng Town, Langzhong City. Total length of main stream of Donghe River294km, basin area5181km2, of which the domestic area4143.4km2Average river gradient1.73Per thousand, the average annual precipitation depth for many years1164.6mmAverage annual runoff depth for many years.642.9mmAverage discharge of estuary for many years106mthree/s.
(eleven) Xihe:A tributary of the right bank of Jialing River. Originated in Yinjiasi Village, Yunji Township, jiangyou city, it flows through jiangyou city, Jiange County, Langzhong City, nanbu county and Peng ‘an County, and joins Jialing River in Yin He Village, Pingtou Township, Peng ‘an County. Total length of main stream300km, basin area3692km2, of which the domestic river basin area1072km2Average river gradient0.621Per thousand, the average annual precipitation depth for many years956.1mmAverage annual runoff depth for many years.316.3mmAverage discharge of estuary for many years37mthree/s.
(12) Nanhe:A tributary of the left bank of Jialing River. Originated in Yang Jiacun, Lianghekou Township, Chaotian District, Guangyuan City, it flows through Chaotian District, Zhaohua District and Lizhou District, and joins Jialing River at the lower two estuaries of Tiancheng Bridge in downtown Guangyuan City. Total length of main stream of Nanhe River79km, basin area1076km2River gradient9.38Per thousand, the average precipitation depth in the basin for many years1055.5mmAverage runoff depth for many years546.5mmAverage discharge of estuary for many years18.7mthree/s.
(13) Wenxi River:A tributary of the right bank of Jialing River. Originated in Jianshanzi, Wuzhi Village, northwest of Yandian Town, Jiange County, it flows through Yandian Town, Yaojia Township, Beimiao Township, Chengbei Town, Pu ‘an Town and Wenxi Township in Jiangkou Town, Jiange County and joins Jialing River. Total length of main stream59km, basin area534.2km2, of which the domestic river basin area534.2km2Average river gradient3.12Per thousand, the average annual precipitation depth for many years1027.6mmAverage annual runoff depth for many years.466.5mmAverage discharge of estuary for many years7.90mthree/s.
(14) Bai Xihao:A tributary of the right bank of Jialing River. Originated in Yonghong Village, Long Yuan Town, Jiange County, it flows through Hefeng Township, Bailong Town, Beiya Township, Gongxing Town, Tu Shan Township, Xiangchen Town, Helou Township, Siyi Town, Qiaolou Township, Chanlin Township, Cangxi County, Bamiao Town, Zaobi Township, Yakou Township and Jiangnan Township in Langzhong City. Total length of main stream100km, basin area803km2, of which the domestic river basin area544.3km2Average river gradient1.82Per thousand, the average annual precipitation depth for many years969.3mmAverage annual runoff depth for many years.306.0mmAverage discharge of estuary for many years7.79mthree/s.
(15) Guangyuan section of Qujiang River Basin:The part of Qujiang River Basin in Guangyuan City is mainly the upstream rivers and their sources of its tributaries: Xiaba River, Xiasha River, Siyang River and Maoxi River. Runoff is mainly replenished by precipitation, and the basin area is about.1350Square kilometers.
(16) enyang River:The first-class tributary on the right bank of Qujiang River. Originated in Qiaoban Village, Shuimo Township, wangcang county, it flows through wangcang county, Nanjiang County, Bazhou District and Enyang District of Bazhong City and joins Qujiang River in Sanjiangkou Community, sanjiang town, Bazhou District, Bazhong City. Total length of main stream142km, basin area3049km2, of which the domestic river basin area682.4km2Average river gradient2.02Per thousand, the average annual precipitation depth for many years1087.9mmAverage annual runoff depth for many years.452.2mmAverage discharge of estuary for many years43.7mthree/s.
Second, others
(1) Counties and districts:The second national census of pollution sources regards Guangyuan Economic and Technological Development Zone as an independent census at the county level to account for the generation and discharge of pollutants. Therefore, the term "county" in this bulletin generally refers to the collection of Cangxi County, wangcang county, Jiange County, Qingchuan County, Lizhou District of Guangyuan City, Zhaohua District of Guangyuan City, Chaotian District of Guangyuan City and Guangyuan Economic and Technological Development Zone, except in certain circumstances.
(2) Error:No mechanical adjustment has been made for the errors caused by the choice of decimals in the total figures and some calculated data in the bulletin.