The Ministry of Ecology and Environment announced the national surface water environmental quality in the third quarter of 2023 and from January to September.
On October 28th, the Ministry of Ecology and Environment announced to the media the national surface water environmental quality in the third quarter of 2023 (July-September) and January-September.
Overall situation
In the third quarter, among the 3,641 national surface water assessment sections, the proportion of sections with excellent water quality (Class I-III) was 77.3%, down 1.7 percentage points year-on-year; The proportion of inferior V section was 0.9%, down 0.2 percentage points year-on-year. The main pollution indicators are chemical oxygen demand, permanganate index and total phosphorus.
From January to September, among 3,641 national surface water assessment sections, the proportion of sections with excellent water quality (Class I-III) was 87.1%, up 0.8 percentage points year-on-year; The proportion of inferior V section was 0.7%, down 0.2 percentage points year-on-year. The main pollution indicators are chemical oxygen demand, permanganate index and total phosphorus.
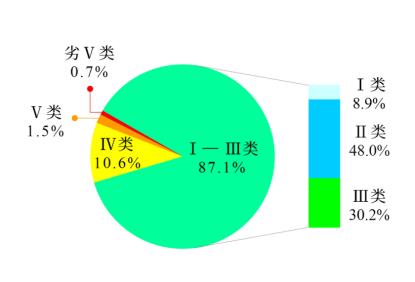
Figure 1 Proportion of surface water quality categories in China from January to September
Water quality status of major rivers
In the third quarter, the proportion of sections with excellent water quality (Class I-III) in seven major river basins, such as Yangtze River, Yellow River, Pearl River, Songhua River, Huaihe River, Haihe River and Liaohe River, and rivers in the northwest, southwest and Zhejiang and Fujian provinces was 80.5%, down 1.8 percentage points year-on-year; The proportion of inferior V section was 0.6%, down 0.3 percentage points year-on-year. The main pollution indicators are chemical oxygen demand, permanganate index and total phosphorus. Among them, the water quality of southwest rivers, northwest rivers and Yangtze River basin is excellent; The water quality of the rivers in Zhejiang and Fujian, the Yellow River Basin and the Pearl River Basin is good; Liaohe, Haihe, Huaihe and Songhua river basins are slightly polluted.
From January to September, the proportion of sections with excellent water quality (Grade I-III) in the seven major river basins, such as the Yangtze River, Yellow River, Pearl River, Songhua River, Huaihe River, Haihe River and Liaohe River, and the rivers in the northwest, southwest and Zhejiang and Fujian provinces was 89.2%, up 0.7 percentage points year-on-year; The proportion of inferior V section was 0.5%, down by 0.2 percentage points year-on-year. The main pollution indicators are chemical oxygen demand, permanganate index and five-day biochemical oxygen demand. Among them, the water quality of the Yangtze River basin, Zhejiang and Fujian rivers, southwest rivers, northwest rivers and the Pearl River basin is excellent; The water quality of the Yellow River, Liaohe River, Huaihe River and Haihe River basins is good; Songhua river basin is slightly polluted.
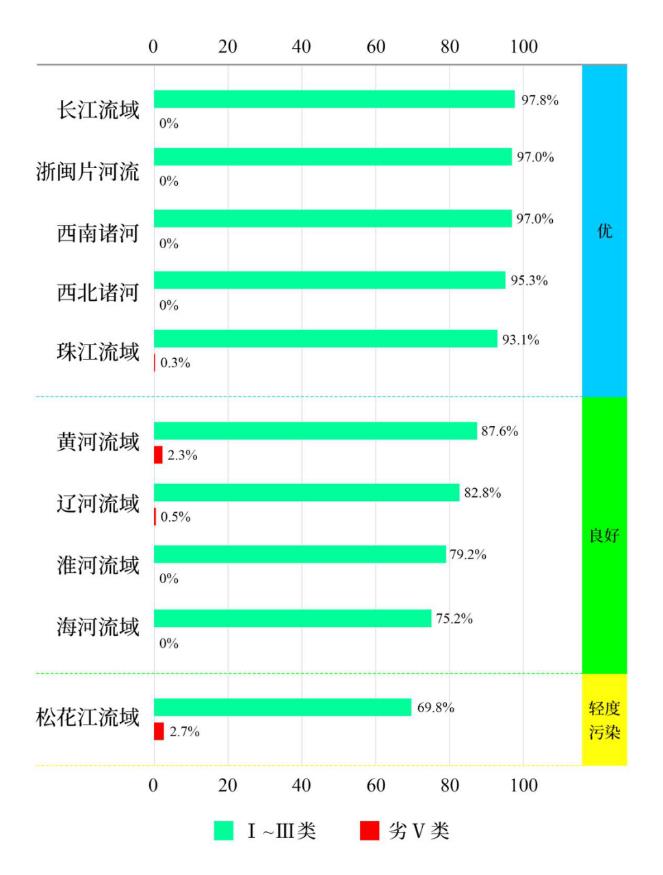
Figure 2 Proportion of water quality categories in seven major river basins, southwest and northwest rivers and rivers in Zhejiang and Fujian from January to September.
Water quality and nutritional status of key lakes (reservoirs)
In the third quarter, among the 209 key lakes (reservoirs) monitored, the number of lakes and reservoirs with excellent water quality (Class I-III) accounted for 72.2%, up 4.1 percentage points year-on-year; The number of lakes and reservoirs with inferior grade V water quality accounted for 3.8%, down 1.0 percentage points year-on-year. The main pollution indicators are total phosphorus, chemical oxygen demand and permanganate index. Among the 204 lakes (reservoirs) monitoring the nutritional status, 18 are moderately eutrophic, accounting for 8.8%; 50 were mildly eutrophic, accounting for 24.5%; The rest of the lakes (reservoirs) are in the state of medium nutrition or poor nutrition. Among them, Taihu Lake is slightly polluted and slightly eutrophic, and the main pollution index is total phosphorus; Chaohu Lake is slightly polluted and moderately eutrophic, and the main pollution index is total phosphorus. Dianchi Lake is moderately polluted and moderately eutrophic, and the main pollution indexes are chemical oxygen demand, total phosphorus and permanganate index. Erhai Lake has good water quality and moderate nutrition; The water quality of Danjiangkou reservoir is excellent and medium nutrition; Baiyangdian Lake is slightly polluted (mainly affected by floods) and moderately nutritious, and the classification index is dissolved oxygen.
From January to September, among the 209 key lakes (reservoirs) monitored, the number of lakes and reservoirs with excellent water quality (Class I-III) accounted for 74.6%, up 0.8 percentage points year-on-year; The number of lakes and reservoirs with inferior grade V water quality accounted for 4.3%, down 0.5 percentage points year-on-year. The main pollution indicators are total phosphorus, chemical oxygen demand and permanganate index. Among the 205 lakes (reservoirs) whose nutritional status was monitored, 7 were moderately eutrophic, accounting for 3.4%; 50 were mildly eutrophic, accounting for 24.4%; The rest of the lakes (reservoirs) are in the state of medium nutrition or poor nutrition. Among them, Taihu Lake and Chaohu Lake are slightly polluted and slightly eutrophic, and the main pollution index is total phosphorus; Dianchi Lake is slightly polluted and moderately eutrophic, and the main pollution indexes are chemical oxygen demand, total phosphorus and permanganate index. The water quality of Erhai Lake and Baiyangdian Lake is good and moderately nutritious. The water quality of Danjiangkou Reservoir is excellent and moderate.
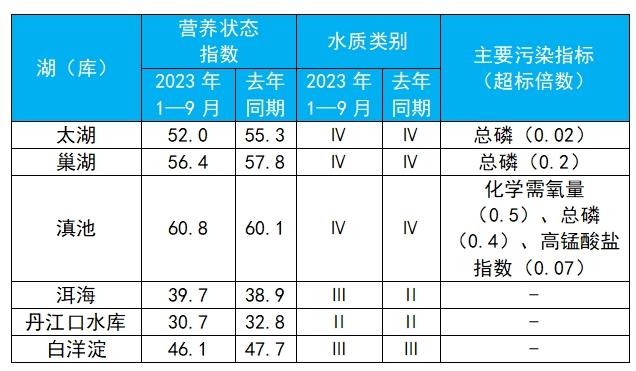
Table 1 Water quality and nutritional status of six lakes (reservoirs) from January to September.
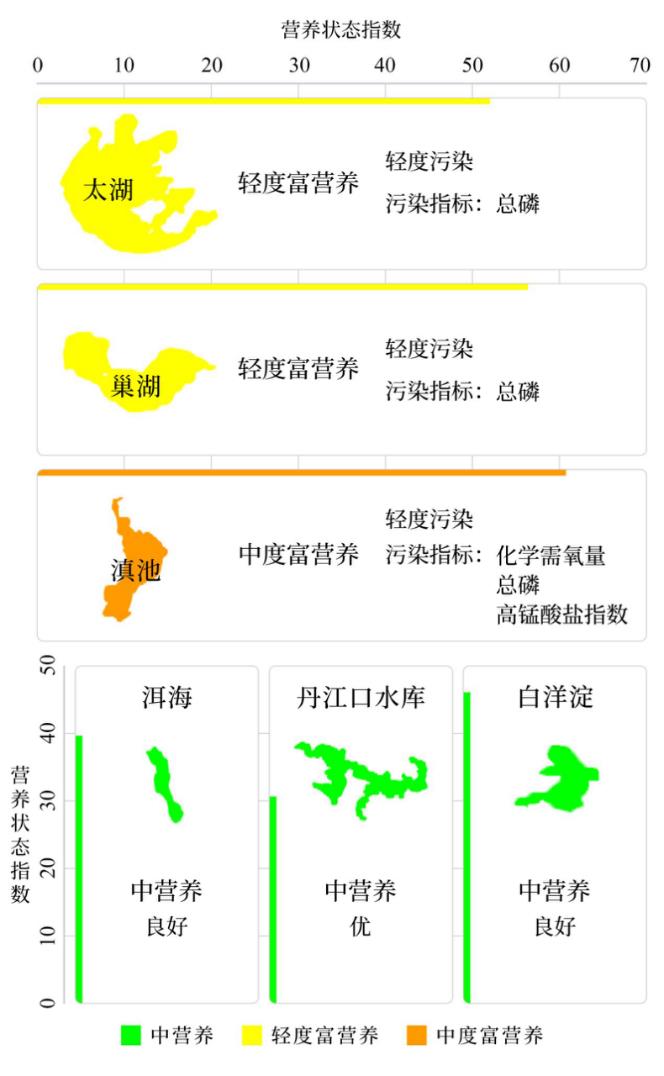
Fig. 3 Water quality and nutritional status of six lakes (reservoirs) from January to September.
Rank of national surface water assessment sections in prefecture-level and above cities
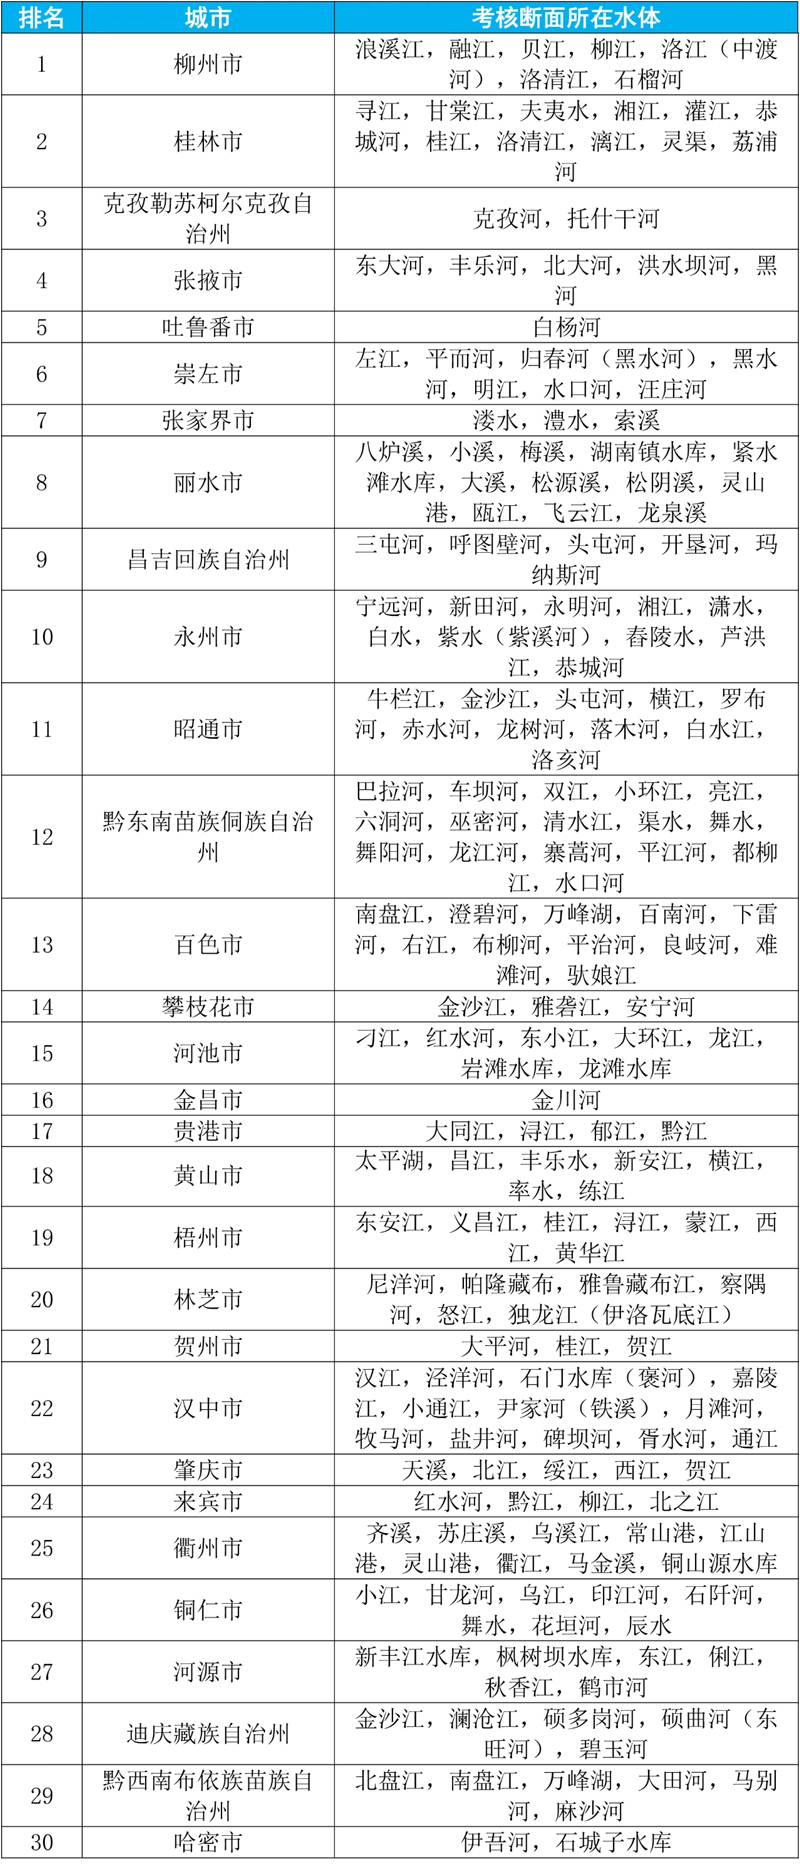
From January to September, among the cities at the prefecture level and above in China, the water environmental quality of national surface water assessment sections in 30 cities such as Liuzhou, Guilin and Kizilsu Kirgiz Autonomous Prefecture was relatively good (from 1st to 30th), while the water environmental quality of national surface water assessment sections in 30 cities such as wujiaqu city, Shangqiu and Tongliao was relatively poor (from 1st to 30th). See Table 1-2.
The changes of water environmental quality of national surface water assessment sections in 30 cities, such as Shihezi, Baicheng and Xinzhou, are relatively good (from 1st to 30th), while the changes of water environmental quality of national surface water assessment sections in 30 cities, such as Hangzhou, Taizhou and Yancheng, are relatively poor (from 1st to 30th). See attached table 3-4.
Schedule 1
From January to September, 2023, the water environment quality of the national surface water assessment section ranked the top 30 cities and their water bodies.
Schedule 2
From January to September, 2023, the water environment quality of the national surface water assessment section ranked the last 30 cities and their water bodies.
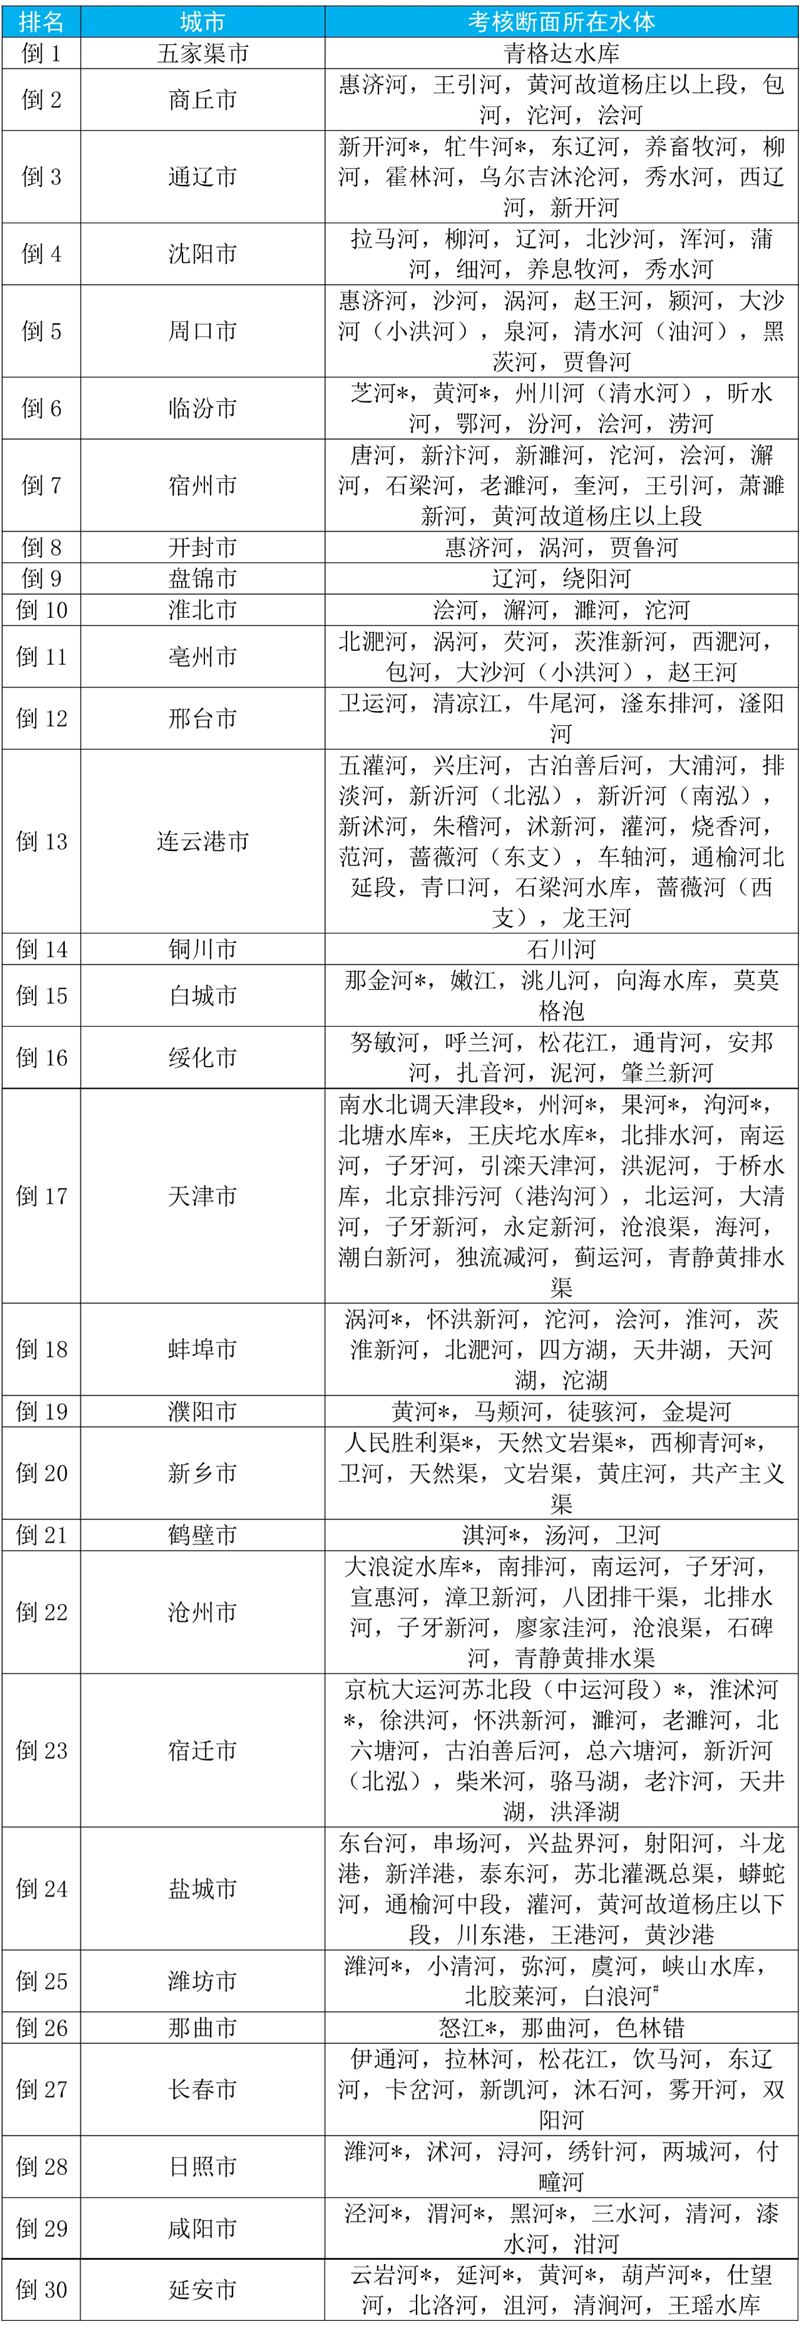
Note: The water quality of the water body marked with * in the table meets Class I or Class II of Environmental Quality Standard for Surface Water (GB3838-2002)Ⅰ); In June and July, the section of Liutuan Bridge in Bailang River in Weifang City was seriously disturbed by human beings, and all the indexes of this section in that month were replaced by the worst value.
Schedule 3
From January to September, 2023, the changes of water environment quality in the national surface water assessment section ranked the top 30 cities and their water bodies.
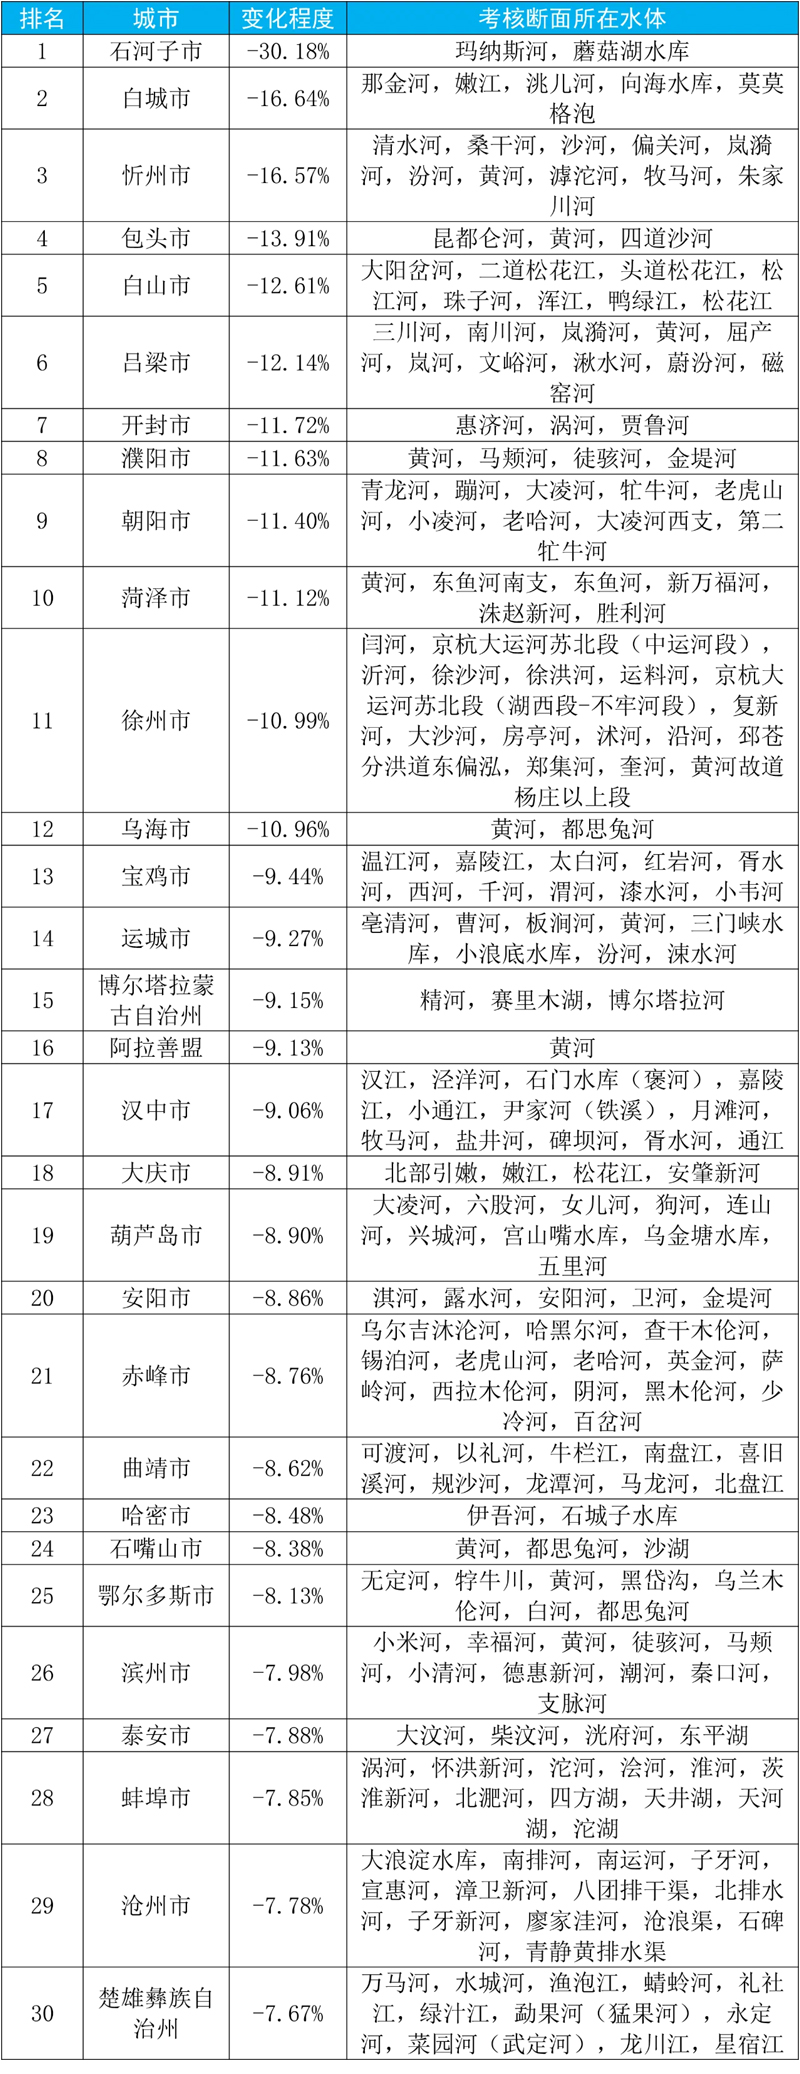
Note: A negative value indicates that the environmental quality of surface water is getting better year-on-year, while a positive value indicates that it is getting worse year-on-year.
Schedule 4
From January to September, 2023, the changes of water environment quality in the national surface water assessment section ranked the last 30 cities and their water bodies.

Note: The water quality of the water bodies marked with * in the table meets Class I or Class II of Environmental Quality Standard for Surface Water (GB3838-2002)Ⅰ).